Skip to content
Security EBITDA for PE portfolios

Show your IC which portco is costing the most EBITDA. And what to fund first.

Valty verifies cyber and AI controls in production, quantifies EBITDA-at-risk with FAIR and Monte Carlo, and ranks remediation by EBITDA recovered per dollar spent. You get a forwardable Proof Pack for the IC, CFO, and CISO. Not another heatmap.

Prioritize fixes by EBITDA recovered per dollar spent. Move the highest-value lever first.

Run EBITDA estimate
15 minFirst EBITDA output4 clicksEvidence to Proof Pack10,000+Monte Carlo runs per exposureContinuousEvidence-freshness checksdesign-partner preview
\ EBITDA Bridge \

Watch cyber risk move enterprise value.

See how cyber exposure changes reported EBITDA. This illustrative $400M revenue manufacturer shows a $4–7M bridge (base case $5.4M) from reported to adjusted EBITDA, modeled with FAIR and 10,000 Monte Carlo simulations.

Starting
$42.0M
Reported EBITDA
RNSMRansomware exposure−$1.8M
DBRCData breach liability−$2.1M
CMPLCompliance penalties−$0.9M
INTRBusiness interruption−$1.4M
INSRInsurance recovery+$0.8M
Adjusted
$36.6M
After cyber risk · $35–38M range
[ THE BOARD ASKS FOR RISK IN DOLLARS · HEATMAPS CANNOT ANSWER ]

More data does not move an IC memo.
A dollar number does.

Your CISO has controls, alerts, and heatmaps. You still do not have a number you can put into an IC memo.

  • Most

    PE portfolio companies carry cyber exposure they have never translated into EBITDA.

    Valty DP 2026
  • $4.7M

    Average industry cost of a data breach. Most boards cannot quantify their own exposure.

    IBM 2024
  • 38d → first pass

    Legacy assessments take weeks. Valty starts from available evidence and keeps method, source, and confidence visible.

    Ponemon / Valty

Base platform + risk reduction modules

Start with the cyber-risk match. Turn on modules to move the number.

Valty Base gives a PE operating team the dollarized cyber-risk view: EBITDA-at-risk, evidence ledger, and proof pack. Each module is an optional control plane that models how much EBITDA-at-risk it can remove, then shows the evidence required to prove that reduction.

Required base

Security EBITDA match

Portfolio exposure, FAIR-style assumptions, board-ready proof, and confidence state. This is the shared risk currency every module attaches to.

EBITDA-at-riskEvidence freshnessProof packModule ROI

Dollar movements are illustrative decision-support examples. Actual before/after ranges depend on source coverage, portfolio context, remediation scope, and proof confidence.

\ Full platform coverage \

See every security domain in dollars you can defend.

GRC, cyber risk quantification, AppSec, AI governance, supply chain, and more. Each shows where it stands today (live, design-partner, or roadmap) and the proof it produces. Honest coverage, not a wishlist.

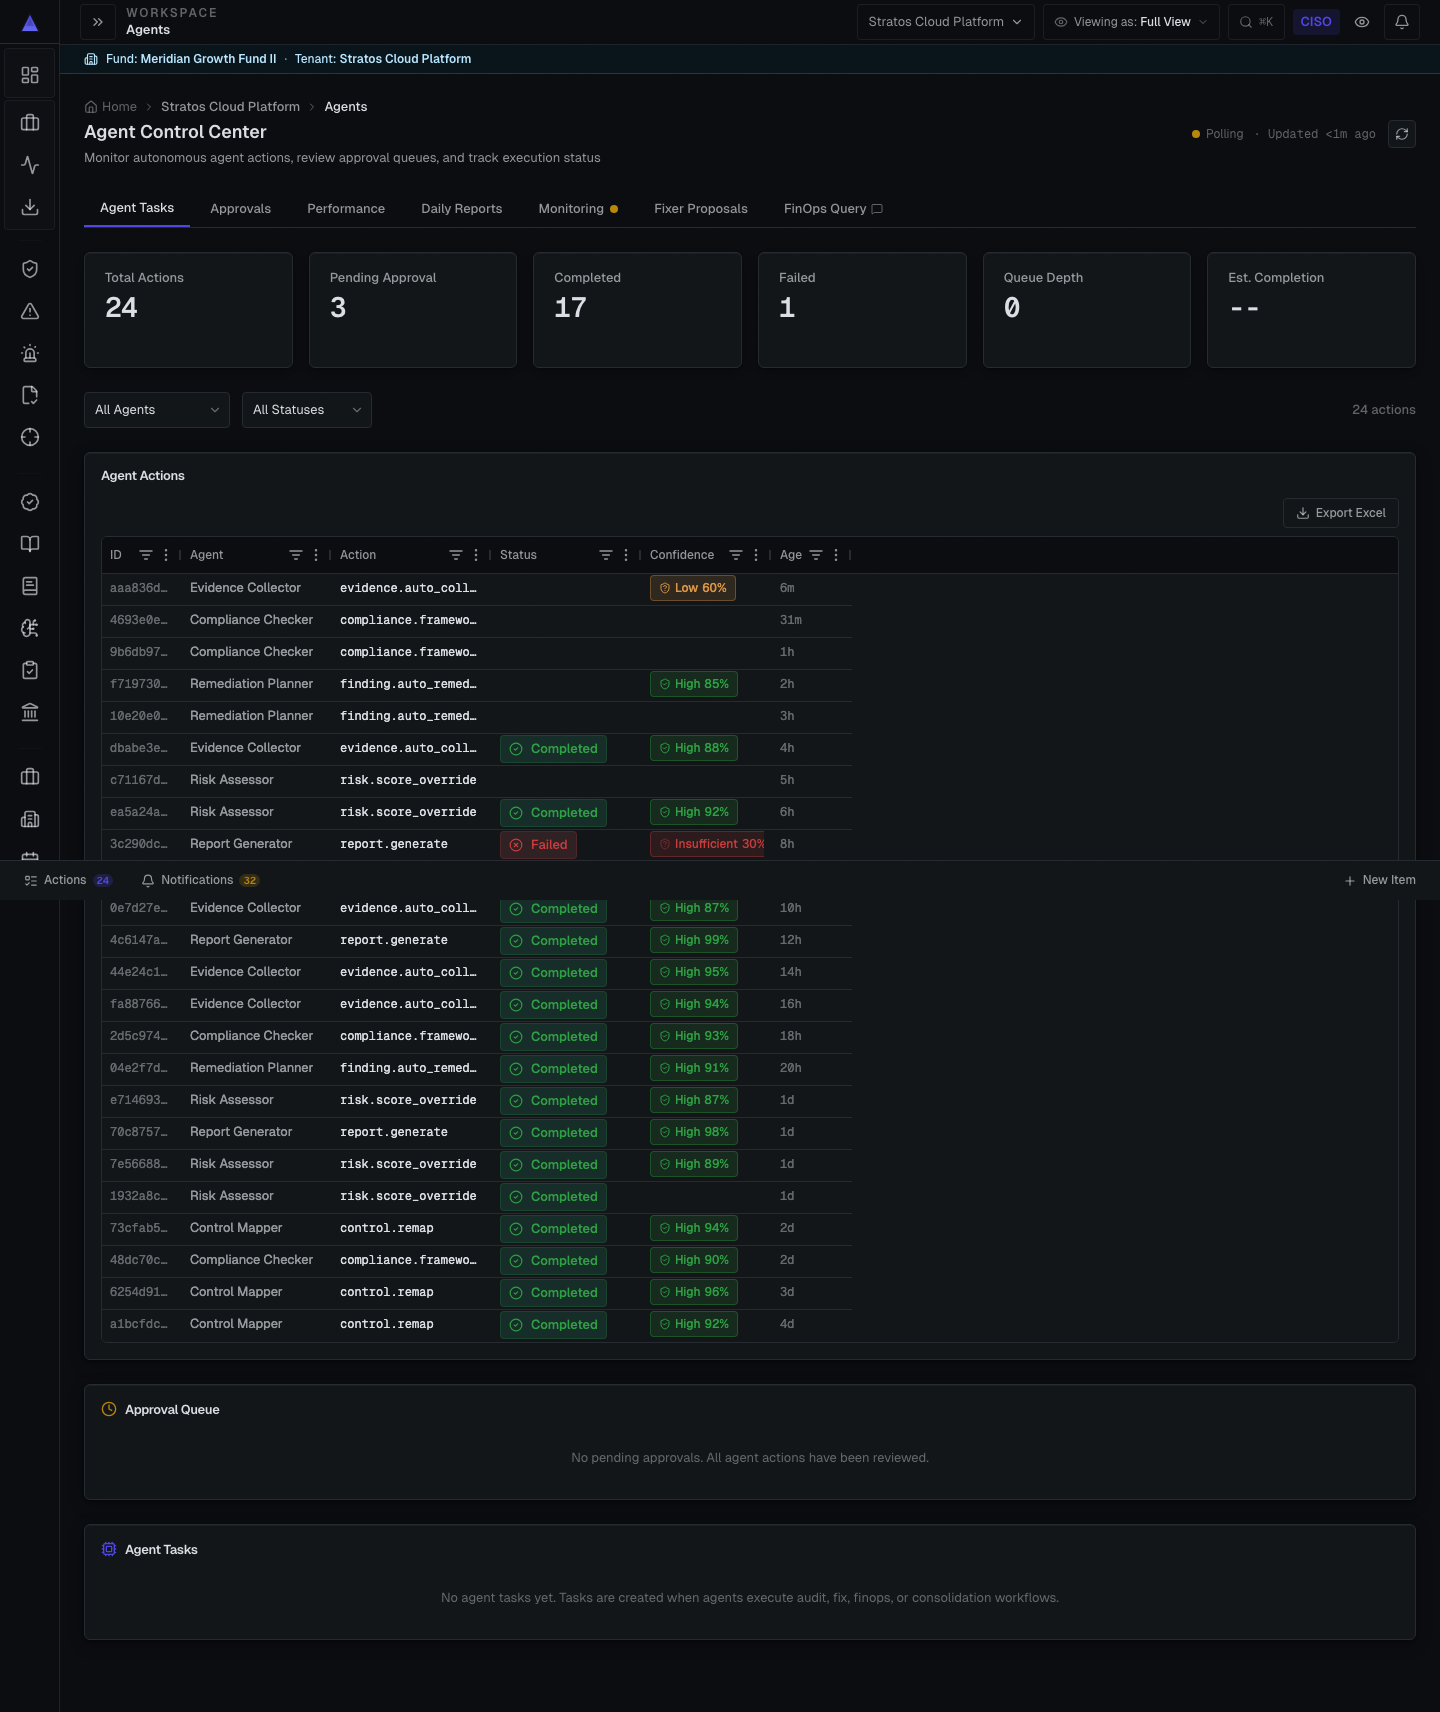
Valty control catalog: evidence freshness, source link, and confidence tier per control
Control catalog: evidence freshness, source system, confidence tier, and owner per control. Design-partner build on demo tenant.
Live
GRC / IRMLive evidence workflow

Proof artifact

Control evidence freshness, proof pack excerpts, audit workflow status

Does not replace auditors, counsel, or required certification bodies.

Live
CRQ / FAIRMethod-backed dollar view

Proof artifact

EBITDA bridge, confidence band, source citations, visible assumptions

Decision-support estimate; not actuarial, legal, or investment advice.

Design partner
ExposureProof-backed closure

Proof artifact

Findings table, remediation queue, closure evidence card

Advanced depth design-partner gated until live validation evidence is complete.

Design partner
AppSec / ASPMAvailable with design partners

Proof artifact

SARIF finding proof, fix verification, release evidence

Consumes SARIF findings and CI signals from your existing AppSec tools today.

Design partner
AI governanceAgent authorization proof

Proof artifact

Agent authorization gate, AI governance checklist, evidence trail

Regulated AI claims require factual review before publication.

Design partner
Supply chainVendor risk evidence

Proof artifact

Component provenance, readiness areas, submission blockers

Federal / UAS readiness language requires claim review before deeper publication.

Live
Trust centerContinuously updated proof

Proof artifact

Proof pack, freshness state, export preview

NDA access-request workflows design-partner gated until controls are finalized.

Live
Portfolio opsFund-level action view

Proof artifact

Portfolio command center, board pack, action queue

Future lifecycle depth labeled until product proof exists per operating motion.

\ One engine, two ends \

OLYDI fixes it at the source. Valty prices and proves the outcome.

The same problem, worked from both ends. Developers close issues where they start, for free. You get the production proof and the EBITDA it protected. Nothing is self-attested, and nothing is left as a finding no one acts on.

Free · for developers

OLYDI

Find and fix at the source

OLYDI finds and remediates security and AI issues inside the codebase, in the developer’s own workflow. Free for developers, so problems get closed where they start instead of piling up in a backlog.

For PE & security leadership

Valty

Price and prove the EBITDA outcome

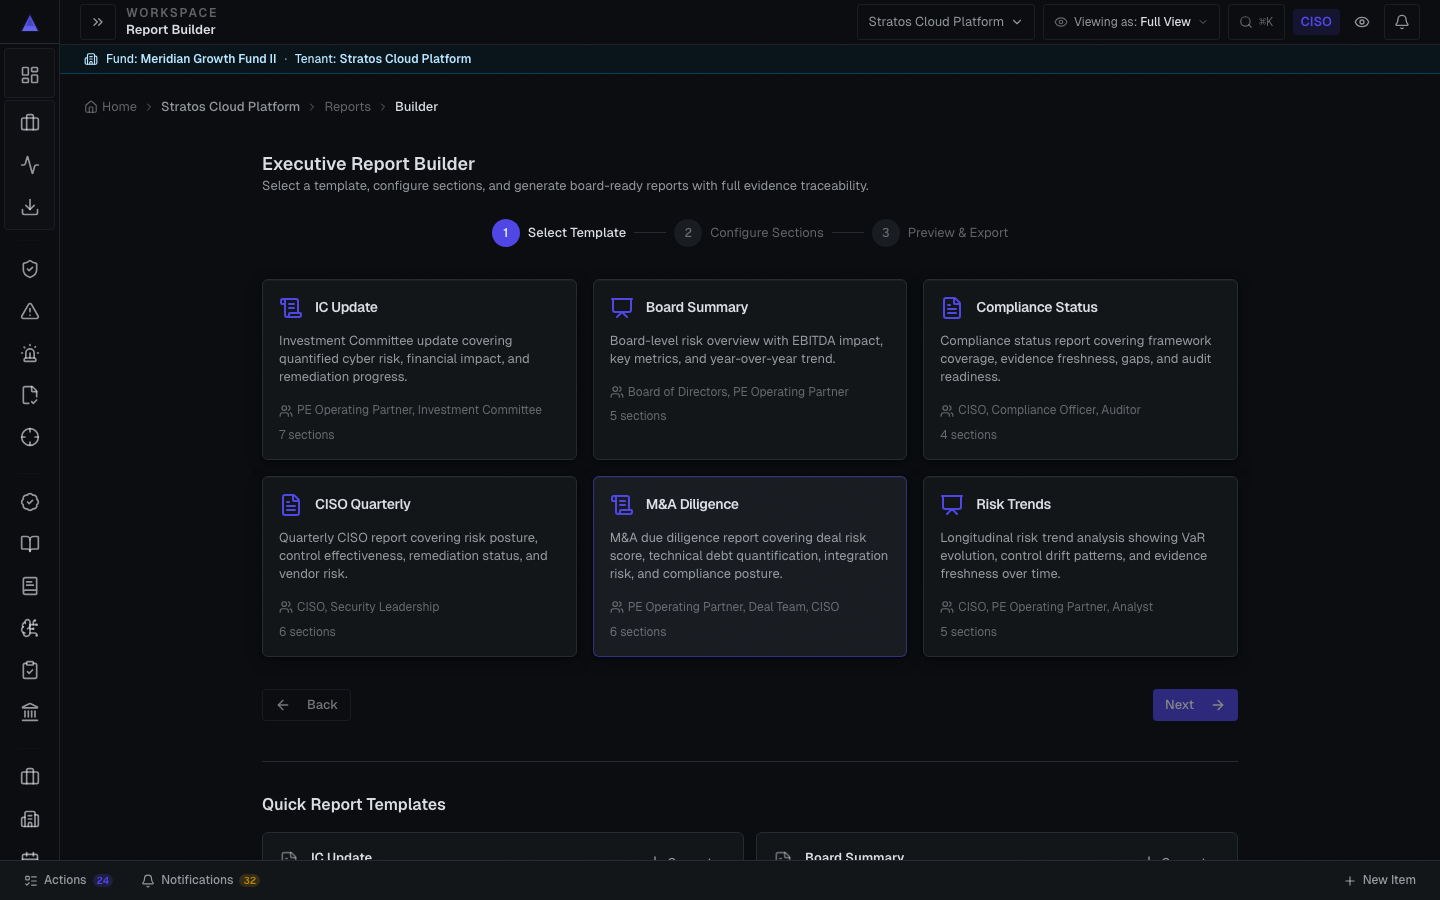
Valty verifies those controls in production, quantifies the EBITDA they protect with FAIR and Monte Carlo, and turns the result into a signed Proof Pack your IC, CFO, and CISO can act on. The fix has a number, and the number has proof.

You are here ↓

Source fix → verified in production → priced in EBITDA → signed proof

10MIN

See your first number in minutes.
Full deployment in 30 days.

You do not wait six months for a dashboard. Valty starts with the evidence you already have, produces first value quickly, and expands into full portfolio visibility from there.

30 days
Full platform deployment
Zero PS
Required to start
\ Portfolio Command \

Every portco. One EBITDA-ranked action list.

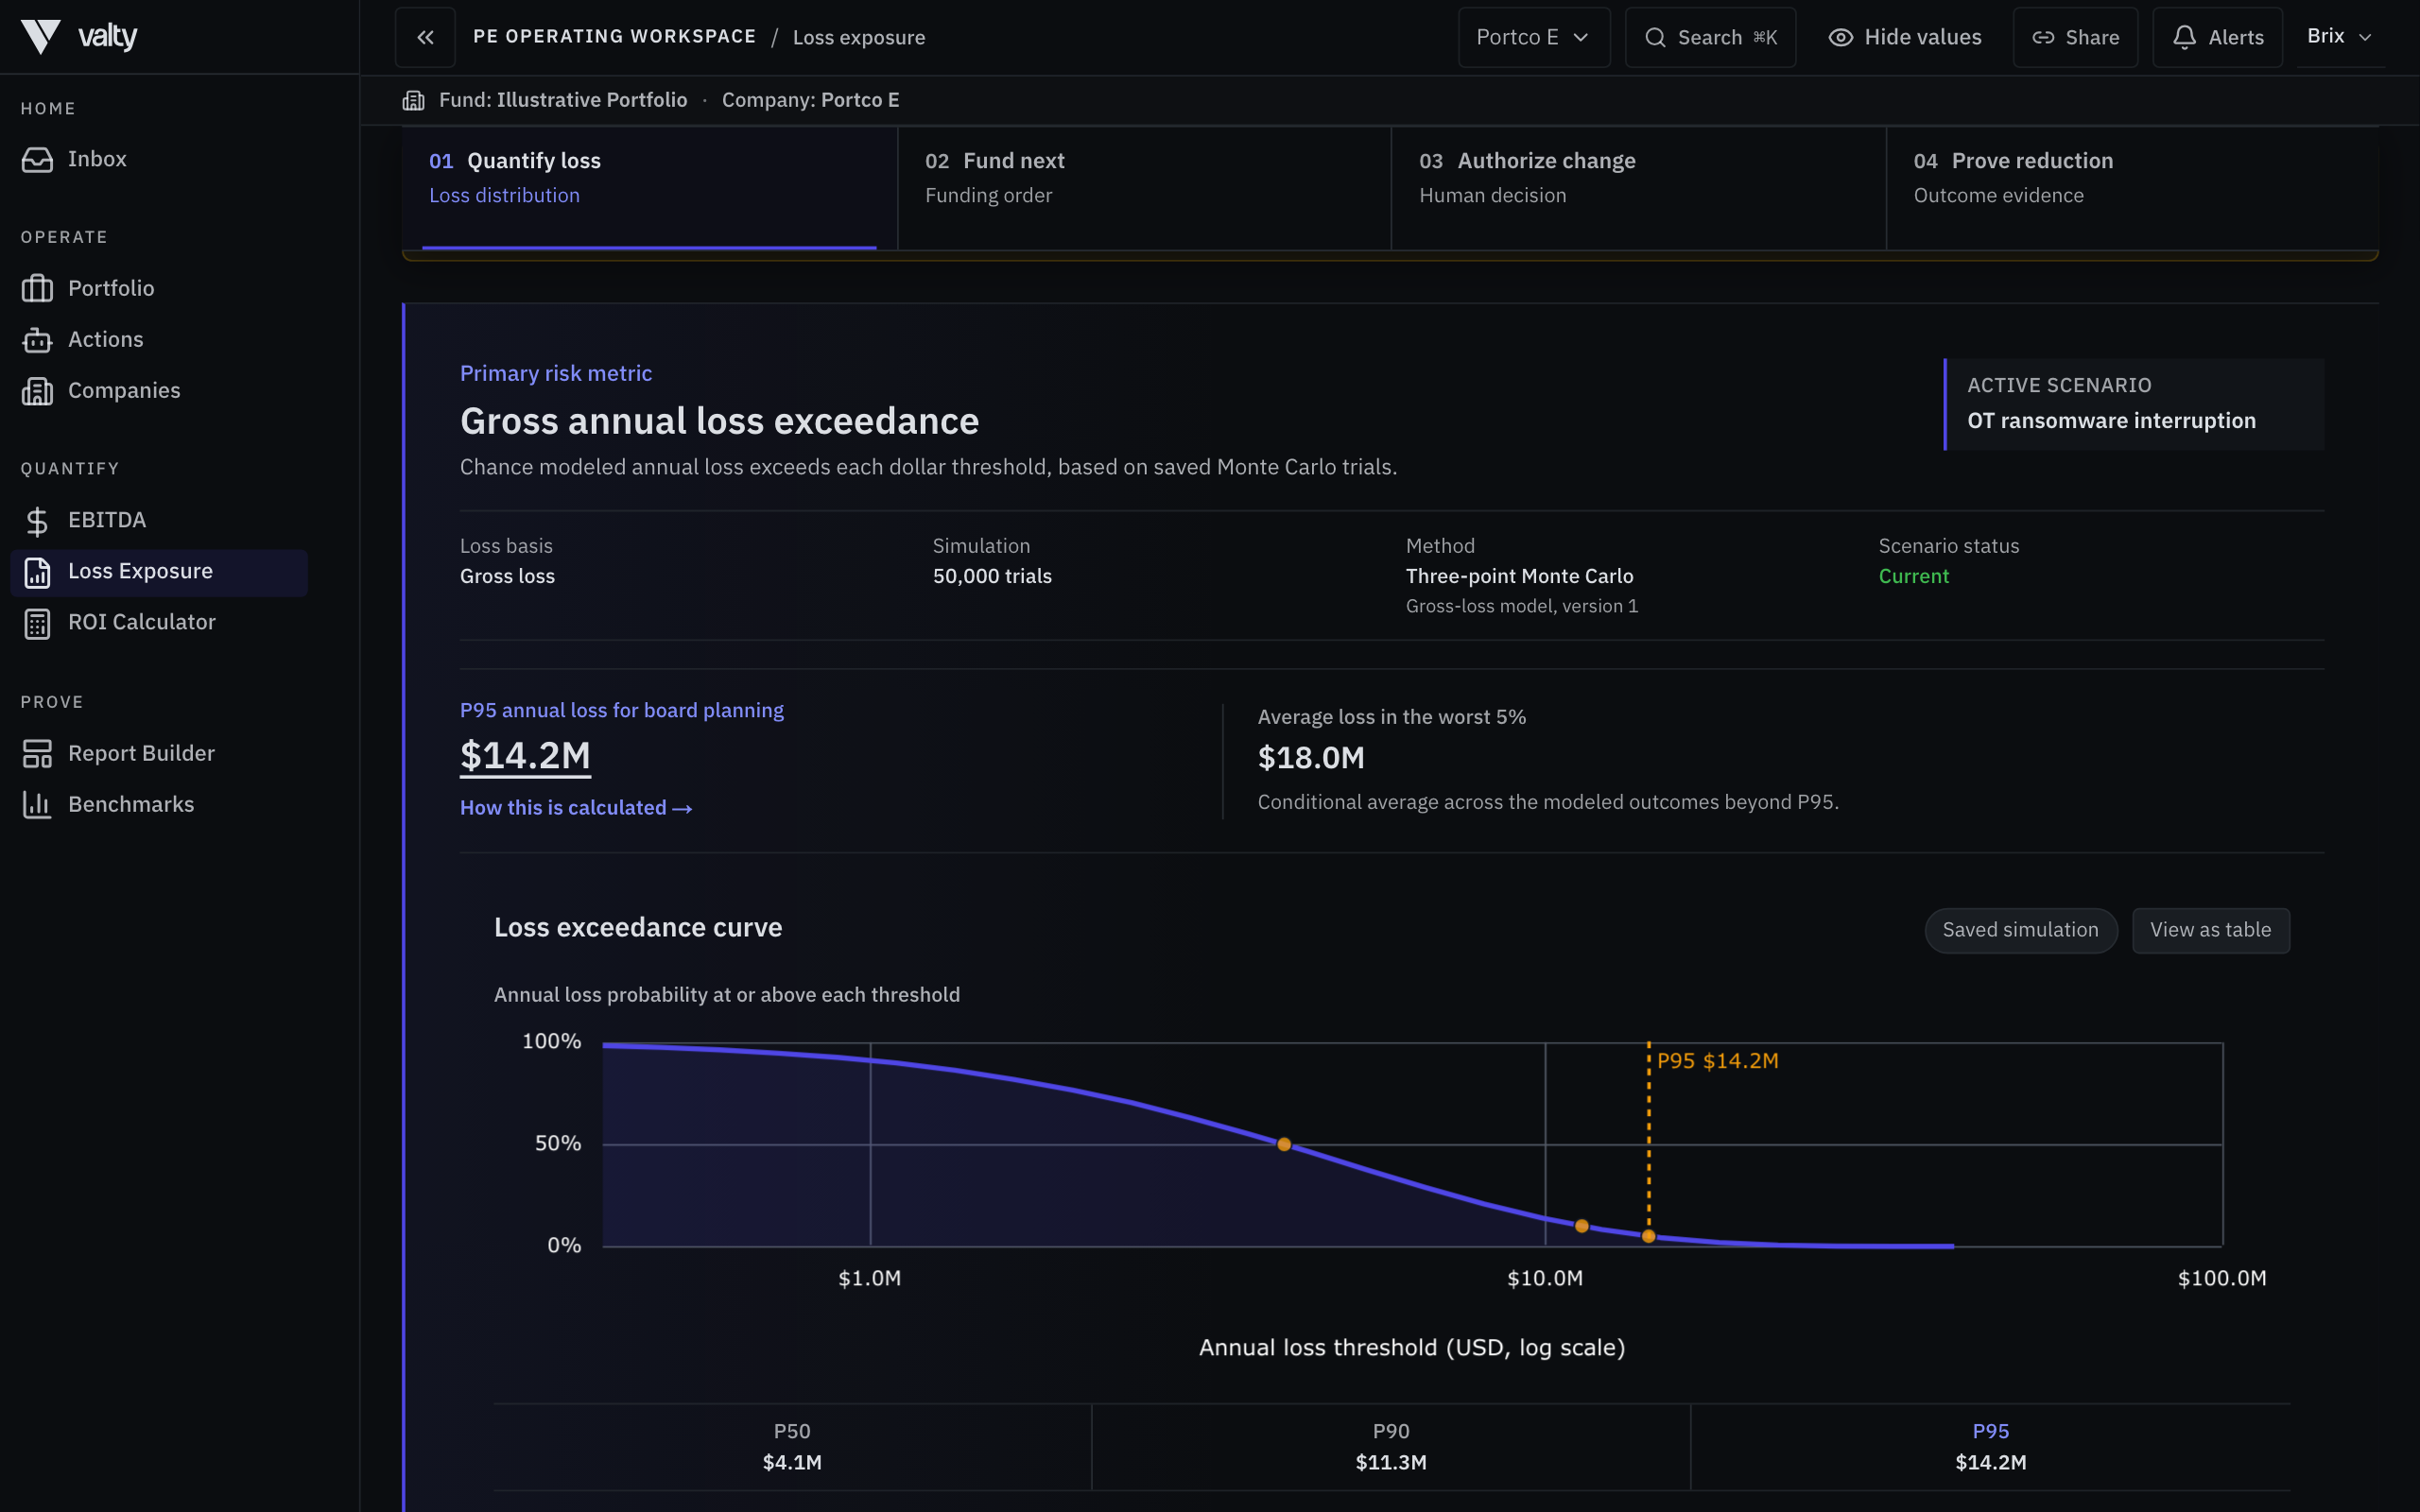
Operating partners need one surface, not fourteen status pages. Portfolio Command aggregates cyber exposure across the fund, prices every finding in EBITDA terms, and surfaces the highest-ROI remediation first.

Illustrative portco data. All figures are modeled outputs from an anonymised design-partner scenario, sourced from FAIR Monte Carlo across 10,000 simulations per company. Not representative of any named firm. Design partner
Portfolio EBITDA-at-Risk, illustrative design-partner scenario
CompanySectorEBITDA-at-RiskTop DriverRemediation CostEBITDA RecoveredROIProof Status
Portco A
Manufacturing
Manufacturing$2.4M$1.9–2.9MUnpatched external attack surface$180K$2.2M12×Proof Pack ready
Portco B
Healthcare services
Healthcare services$4.1M$3.3–4.9MThird-party data processor gap$310K$3.7M12×In review
Portco C
B2B SaaS
B2B SaaS$1.1M$0.9–1.3MMFA coverage below 60%$48K$0.9M19×Proof Pack ready
Portco D
Logistics
Logistics$3.3M$2.6–4MRansomware dwell-time exposure$260K$2.9M11×Pending evidence
Portco E
Industrial controls
Industrial controls$5.7M$4.6–6.8MOT / IT boundary control gap$420K$5.1M12×In review
Source: FAIR Monte Carlo · 10,000 simulations per portco · Illustrative design-partner scenario Design partner
Portfolio Command Center: portfolio-wide value at risk with a P10–P90 confidence band and tail-dependent VaR across portfolio companies
Portfolio CommandPortfolio Command: a live platform surface designed to aggregate a full portfolio into one ranked EBITDA action list. Each row is a ranked action, not a color-coded heatmap.
\ What backs the number \

You don’t have to take the number on faith.

We have no customer logos to parade, and we will not invent any. What stands in their place is method you can inspect and a stage we state honestly. The product’s own claim-gate blocks unsupported assertions from a Proof Pack; we hold this page to the same rule.

10,000

Monte Carlo runs behind every dollar figure, FAIR-aligned and run against your own revenue model — not a color-coded heatmap.

P10–P90

Confidence band shown on every output. You see the range and the assumptions, never a single point estimate presented as fact.

4 fields

Method, source coverage, confidence, and freshness travel with every claim, so any driver can be challenged directly.

0

Fabricated logos, invented case studies, or revenue claims. We are at design-partner stage and state it plainly, here and in every conversation.

Design-partner cohort in progress. Customers named here only when they choose to be, never before.

\ Limited availability \

Help shape Security EBITDA.
Lock in founder pricing.

Cohort20 seats
Capped at 20 seats · founder pricing for the first partners
What you get
  • Direct access to the team building your EBITDA-risk workflow
  • Priority input on the PE workflows you need first
  • Pricing that will never be available again
What we get
  • Candid feedback on workflows, assumptions, and Proof Packs
  • Real portfolio evidence to validate the model
Eligibility · PE-backed companies or funds with $200M+ revenue exposure

Common objections

Questions buyers ask before they engage.

These are the real questions a CISO, CFO, or PE operating partner asks about a cyber-risk platform that translates exposure into EBITDA impact. Answered directly, with the same claim discipline the product enforces.

Is the dollar number actually defensible?

Every financial output Valty produces carries four fields visible at the point of use: method, confidence band (P10 / base / P90), source coverage, and freshness date. The number is not decorative. It is a decision-support estimate built on a FAIR-aligned Monte Carlo model that shows its assumptions rather than burying them in a disclaimer.

What “defensible” means in practice: the EBITDA bridge shows which control gaps drive the exposure, what probability and magnitude assumptions underlie each scenario, and what the evidence coverage is for each assumption. A CFO or board reviewer can challenge any individual driver directly, rather than needing to accept or reject a headline figure on faith.

The model does not claim precision it cannot earn. Outputs are labeled decision-support estimates. When source coverage is thin, Valty labels the evidence gap and can block the claim from publication rather than silently publishing it. V1 does not automatically rewrite FAIR input ranges solely because source coverage is thin.

Method: FAIR-aligned Monte CarloConfidence: Displayed inline, P10–P90Freshness: Linked to source evidence refresh cadenceDesign partner
What do you need to install, and what access does this require?

Valty works from available evidence. It does not require a new scanner, agent install, or privileged shell access to your production environment. The typical starting point is read access to the evidence sources you already operate: a scanner export, a GRC control export, a cloud security posture signal, or an identity and findings feed.

The platform ingests, normalizes, and enriches what is already there, and sits above your systems as a translation layer. Getting started does not require replacing them. Source adapters are scoped by the customer; data flows into Valty on the terms you define, not ours.

In the design-partner stage, the integration is co-designed with your team. We map which evidence sources cover which control domains, agree on freshness thresholds and owner assignments, and scope the connector surface to exactly what the proof motion needs, and nothing more.

No new scanner requiredSource access: read-only, customer-scopedAugments your existing stack — no rip-and-replace to onboardDesign partner
How is this different from a GRC tool or a security rating?

Security ratings (BitSight, SecurityScorecard, etc.) score your external attack surface from the outside. They are fast and comparative, but they do not see your control verification state, your internal finding remediation status, or what the exposure means for EBITDA.

GRC platforms (ServiceNow, Archer, Tugboat Logic, etc.) track control frameworks, policy compliance, and audit workflows. They are the authoritative control register. What they rarely do is translate verified control gaps into a financial impact estimate a CFO or board can act on, or rank remediation priorities by ROI rather than framework weight.

Valty is a translation layer, not a competitor to either. It reads from your GRC and your scanner, maps control gaps to financial exposure scenarios using a FAIR-aligned model, ranks remediation by expected EBITDA impact per dollar spent, and packages the result as a board-ready proof artifact with source, confidence, and freshness visible. The GRC is still the control record. The rating is still the external signal. Valty is the business-impact layer above both.

Ratings: external signal only. Valty: verified internal control stateGRC: control record. Valty: financial translation + proof packagingIntegration: reads from both; no rip-and-replace to onboardDesign partner
Do you store our security data, and who owns it?

Your source-of-truth systems stay yours. Valty does not become the record system for your controls, findings, cloud posture, identity state, or financial model. Those remain in the systems you already operate.

Valty normalizes evidence from those systems into a proof object, a structured artifact that links the claim, the source, the confidence, the freshness, and the publication state. That proof object is tenant-isolated within your Valty workspace. No cross-tenant evidence exposure. No shared inference across accounts.

Data residency, retention periods, and subprocessor scope are addressed in the vendor security questionnaire and NDA, which are part of every design-partner onboarding. We do not publish detailed subprocessor lists without a reviewed trust-center artifact behind them. Contact security@valty.ai for the current security posture package.

Customer owns source systemsProof objects: tenant-isolated in your workspaceSecurity posture: available under NDA or design-partner onboardingDesign partner
You do not publish customer logos or references. Why should we trust this?

Valty has an active confidential design partnership, but does not publish the partner's identity or engagement specifics. We do not turn confidentiality into implied payment status, customer-authorized production scope, source authorization, or customer outcomes.

The current proof ladder is explicit. Valty-on-Valty dogfooding is real internal production evidence for the control, evidence, and governance workflows. The active design partnership adds external validation. The authenticated seeded demonstration shows the product path safely, but is not production or customer-outcome proof.

What buyers can evaluate directly is the deployed product, published methodology, inspectable proof model, and stage-labeled scenario library. Paid/customer outcomes, portability, and willingness to pay require separate evidence and are not represented here.

Stage-honest positioning is a constraint we enforce technically: the product’s claim-gate blocks unsupported assertions from being published in proof packs. We apply the same discipline to our own marketing copy.

Internal production proof: Valty-on-Valty dogfoodExternal validation: active confidential design partnershipPaid/customer outcomes: not representedDesign partner
\ Design partner \

Your EBITDA is already at risk.
Now you can measure it.

Bring one portfolio company or business unit. In 30 minutes, see Valty quantify cyber exposure in dollar terms on the live platform.

Dollar riskQuantified in the room
BoardBoard Brief available
30mLive platform walkthrough