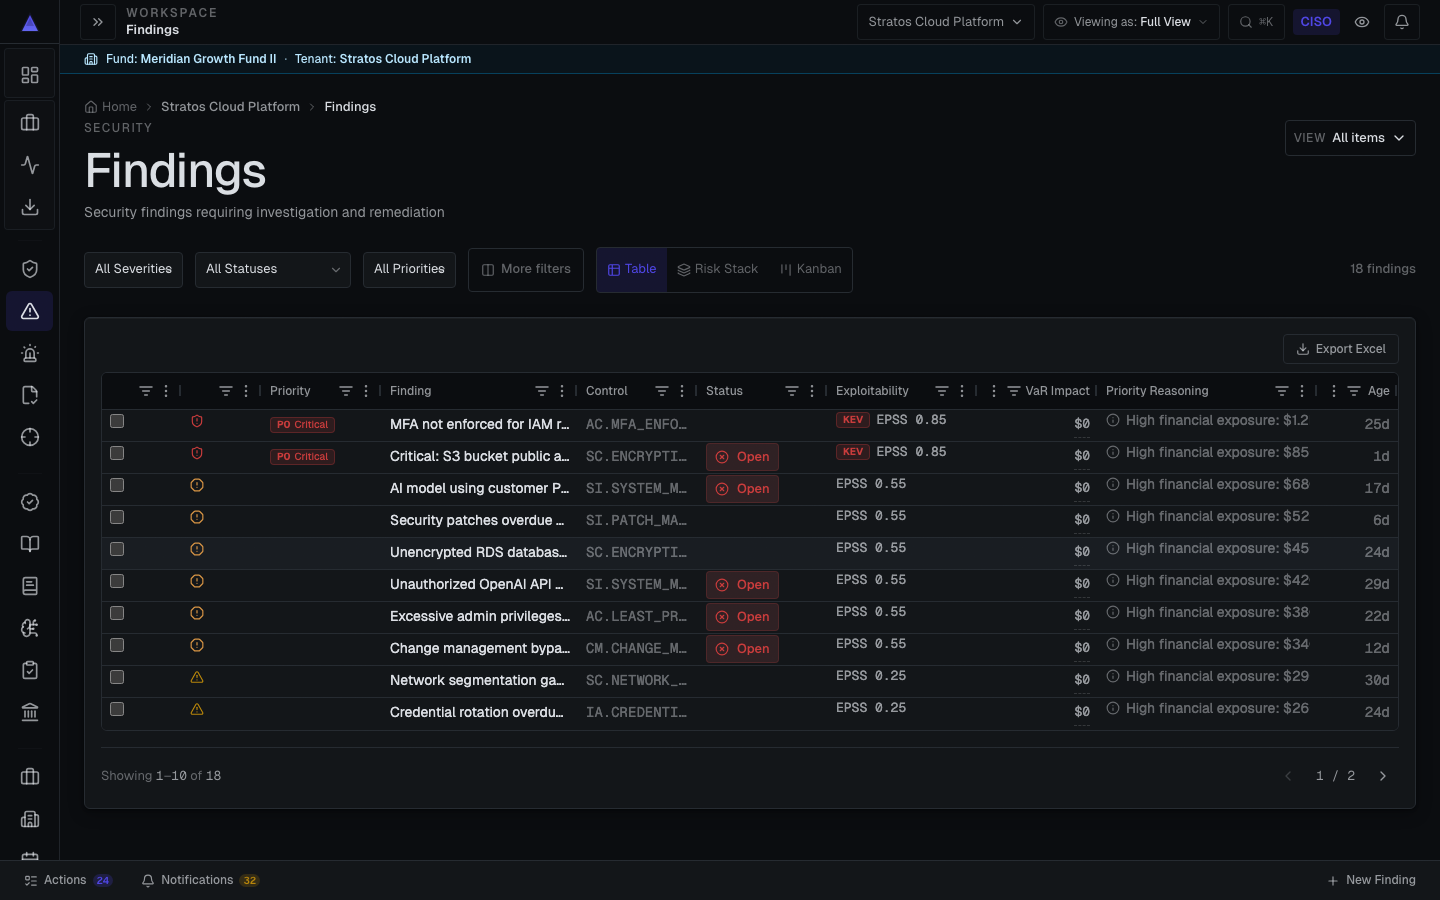
From a Security Finding to a Funding Decision
Connect a finding to its business loss scenario, compare affordable actions and require post-change evidence. Modeled loss is not an EBITDA adjustment.
A security finding identifies a technical condition. Turning it into a funding decision requires more: the affected business service, a plausible loss scenario, credible evidence, action costs and an agreed objective. The financial output is modeled loss exposure. It is not an automatic adjustment to reported EBITDA.
This guide follows that reasoning from a finding to an owned decision. Its operating example is conceptual; the separate fictional funding memo supplies the reproducible numerical example. Neither demonstrates a customer deployment or an executed remediation.
Map the finding to a business service
Start with a source identifier, affected asset, observation date and collection scope. A code finding may name a repository; the decision owner needs to know whether that code serves payments, production scheduling or another business process.
Then document a plausible event and its consequences. Which records could be exposed? What work could stop? Which dependencies affect recovery? Revenue is context for the scenario, not a direct loss amount. Avoid counting the same interruption in several loss categories or treating one scanner finding as one annual loss event.
Retain the original severity and exposure evidence. FIRST's CVSS v4.0 specification includes Base, Threat, Environmental and Supplemental metrics. Those can refine technical prioritization; they do not supply a company's action costs or a monetary annual-loss model.
Define the loss estimate before using it
Separate frequency, per-event severity and annual aggregate loss. The methodology shows how the shared sample simulates annual event counts and per-event losses across 50,000 trials. It reports mean, median and P95 annual gross loss before insurance.
A percentile describes modeled outcomes. It is not the probability that an input assumption is correct, and a P95 difference is not expected savings. Assumptions need their own provenance and sensitivity analysis. Insurance response, if evaluated, needs separately reviewed policy terms; it is not automatically netted from the public sample.
Compare feasible actions under the budget
Agree the decision objective, required work and cost horizon. Compare the full first-year spend for each feasible option, including dependencies and internal effort where applicable. Do not let an unknown cost become zero.
The fictional $100,000 example illustrates why the objective matters. A $90,000 recovery plan has lower modeled P95 than the $70,000 access-hardening plan. Access has lower modeled mean annual loss instead. Both include the required $15,000 tabletop, and combining both optional actions exceeds the budget.
A reduction-per-dollar ratio can help compare assumptions. It does not by itself solve a constrained funding decision: shared prerequisites, overlapping effects, obligations and a tail-loss objective can change the choice. See the worked prioritization guide for the numbers and a sensitivity that reverses the proposed plan.
Keep authorization and execution distinct
The decision record should state fund, defer or validate, with an owner, approver and conditions. Approval does not mean that the change occurred. Agree which supported action Valty can propose or route, which team or provider executes it, and what permissions are required.
The integration guide separates evidence collection from ticket writes. A successful connection proves neither complete evidence coverage nor authority to change the source environment. Exceptions, failed execution and partially completed work need their own visible state.
Require evidence for closure
A finding disappearing from a feed is insufficient on its own: the collector may have failed, changed scope or returned only part of the inventory. Verification should establish the relevant post-change state for the same asset and approved action, with collection time, source and test scope recorded.
For recovery, backup enablement is not a successful restoration. For an access change, collecting a policy is different from showing that the intended access condition holds. An inconclusive or stale result should remain unresolved; a later failed check should prompt review rather than disappear behind an earlier pass.
These are evaluation criteria for a supported workflow, not a claim that every Valty integration performs automatic exact-action verification. Confirm the current implementation and demonstrate its failure cases in the proposed environment.
Carry the result into the next decision
Report three facts separately: what was spent, what control state was observed and what modeled loss changed after the inputs were updated. A modeled reduction is not evidence that an equivalent real loss was prevented.
The proof page and board decision template show how sources, assumptions, ownership and limitations travel with an output. Agree recipient access and review requirements before distributing company evidence. The useful outcome is an inspectable funding decision with accountable follow-through.
Inspect the fictional sample decision memo, or request a platform demo to explore the supported workflow with illustrative data. Company scope, evidence handling, access, onboarding and commercial terms are agreed separately before evaluation.